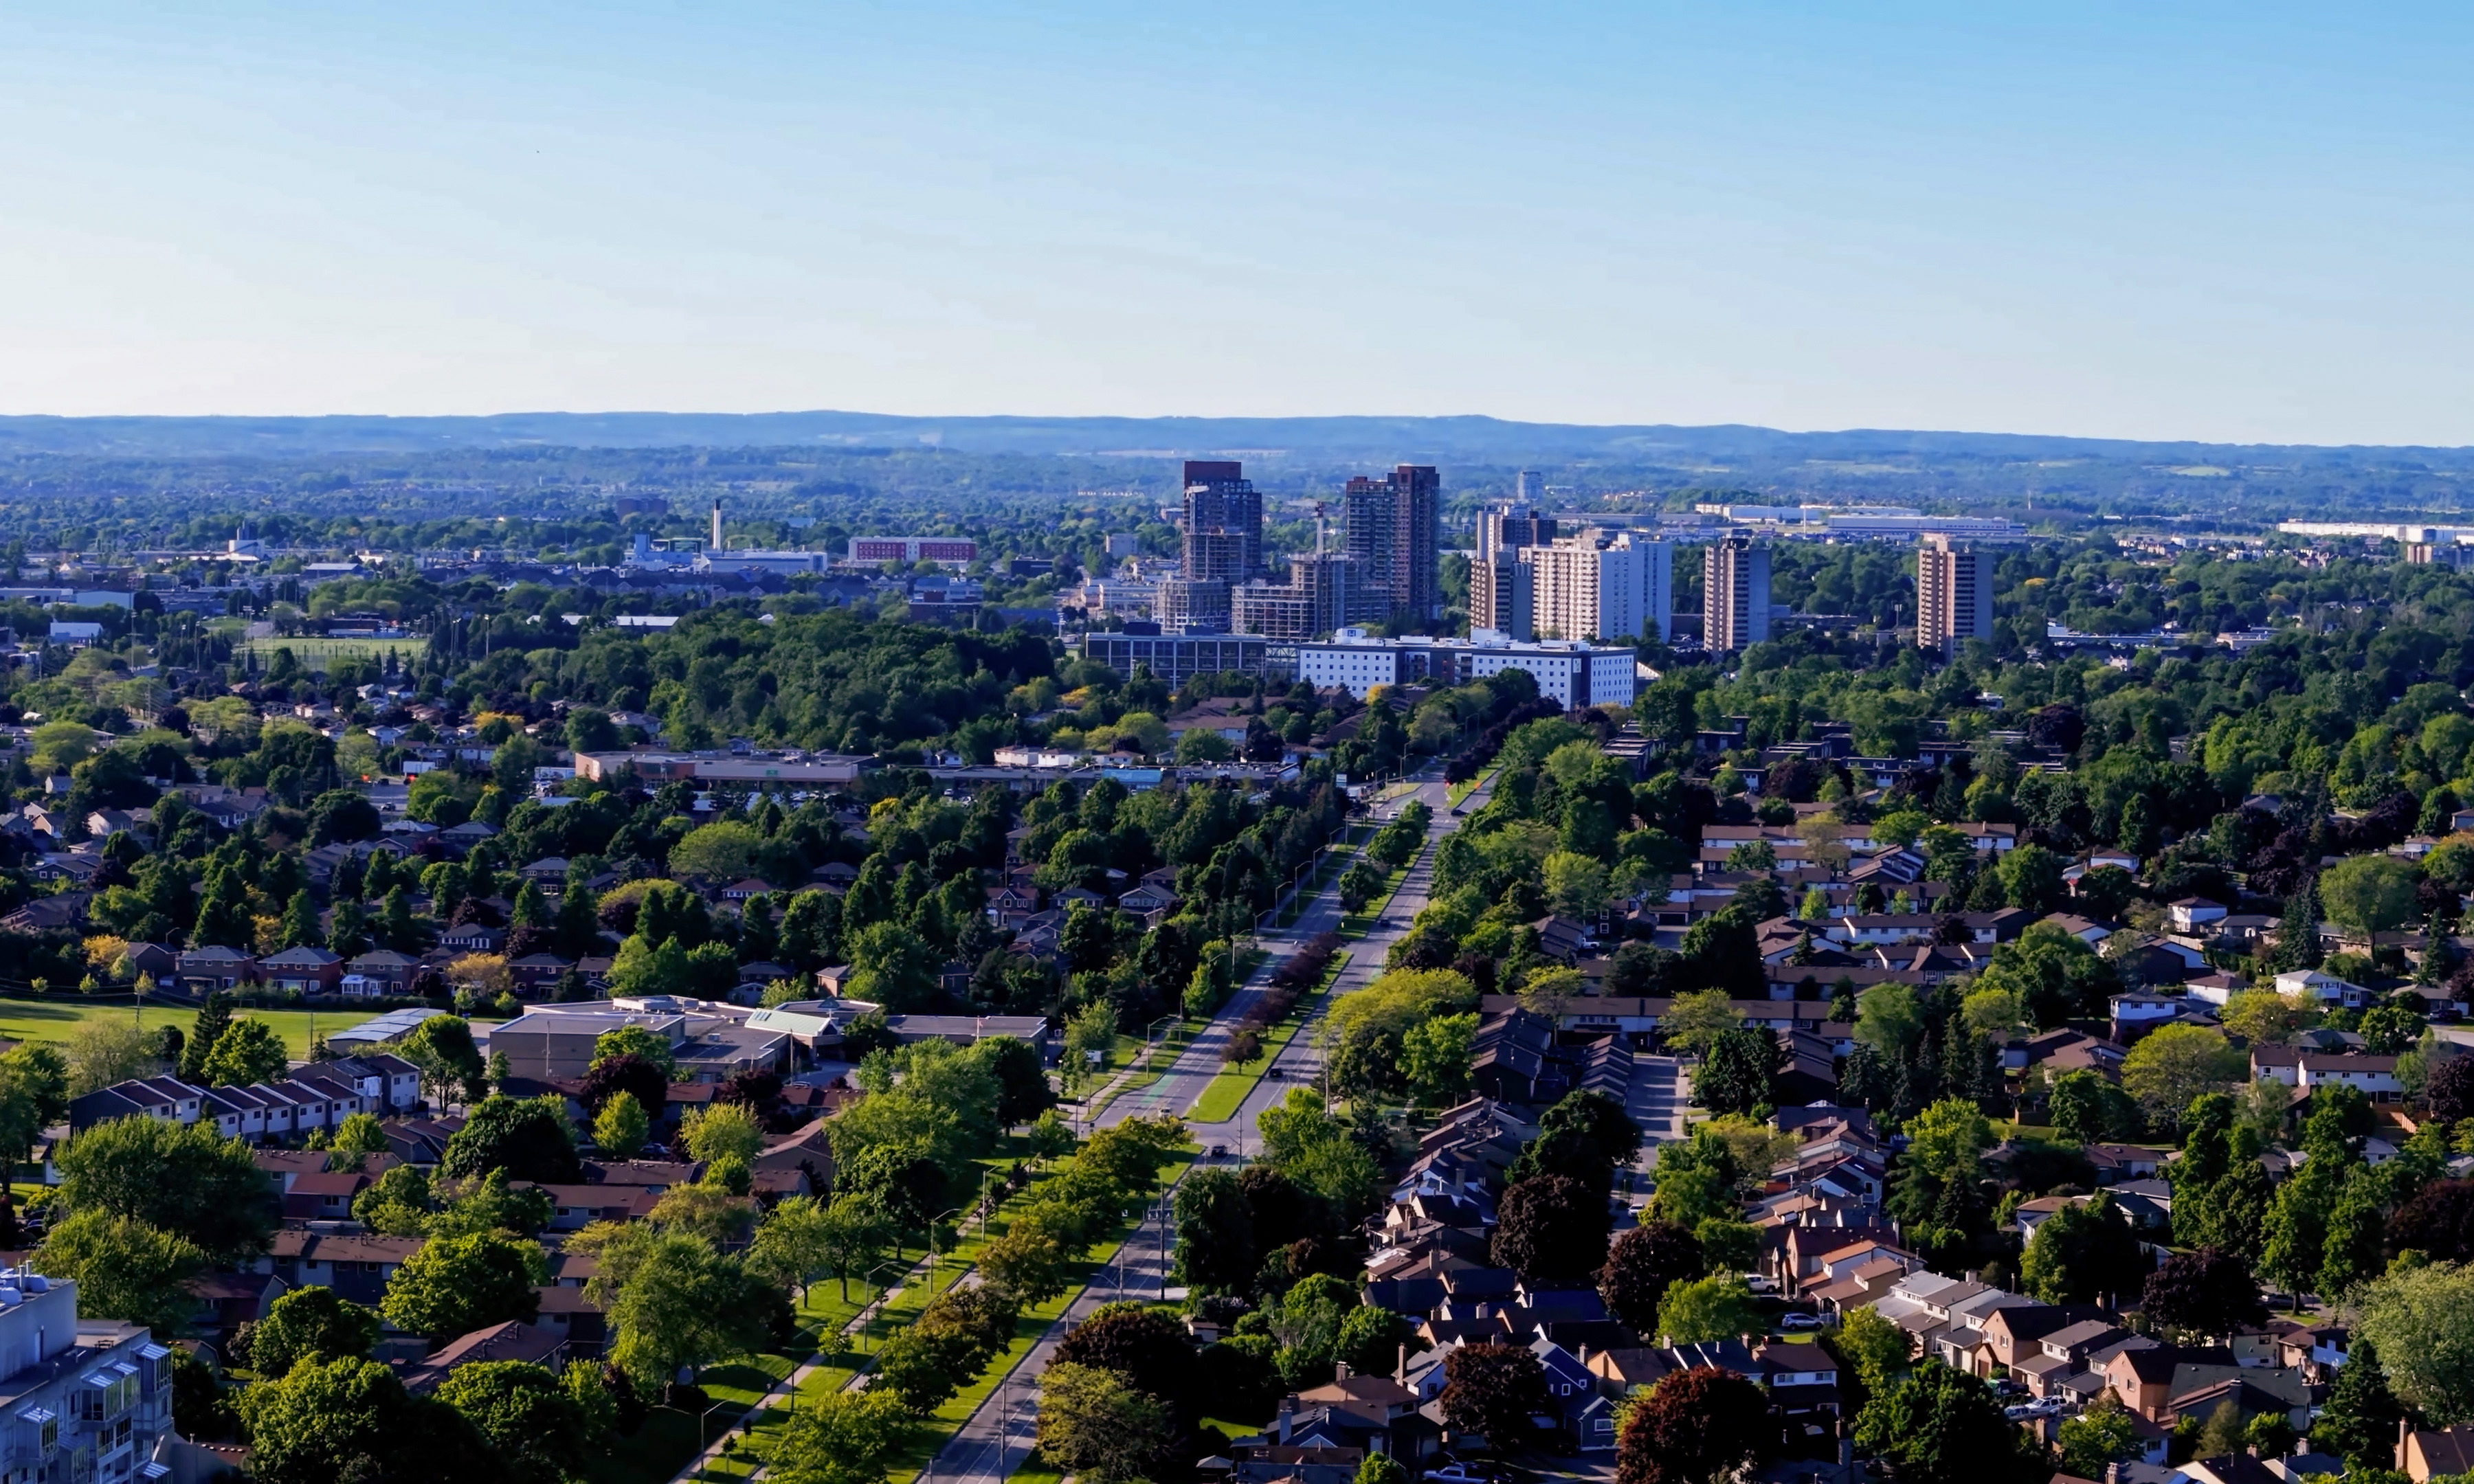
Centre Wellington, Ontario
Wikimedia Commons via Wikipedia

Ontario · Civic arena

Centre Wellington

Centre Wellington drinking water hardness is 229 mg/L on OpenStats, plus City Score rankings and local readings.

Civic arena · hometown HUD

Centre Wellington

Census_agglomeration31k pop
52XP
#142

#142 of 343

52% City Score XP

DroppingGroundwater
City Score XP

6/8 pillars on the board

52%#142

Decade trail

Centre Wellington packs 6 of eight open-data pillars into its composite standing. Tap a rival below to see how the hometown stacks up head-to-head.

Centre Wellington drinking water

Regional estimate from nearest municipal sample

Hardness, pH, and lead from municipal reports on the OpenStats water atlas. This page uses a regional estimate — open the water atlas for method notes.

Hardness
229 mg/L
very hard
pH
8.2
Lead
0.5 μg/L

Full Centre Wellington water quality report →City Score rankingsCompare cities · vs Niagara-on-the-Lake · vs EssexHardness guide

Watershed to tap · system map

How Centre Wellington's water works

Source, treatment, and distribution for Centre Wellington from municipal and provincial water records. Open the animated map for the full watershed-to-tap diagram — no nested topic navigation here.

Local numbers for Centre Wellington

Permits, tax, internet, radon, hazards, drinking water, and sports rankings where a CHL hometown applies.

How Centre Wellington scores

Dropping−37

Centre Wellington sits at City Score rank #142 with a standing of 52%, from 6 of 8 open-data pillars (tax, construction, connectivity, indoor air, water, seismic hazard, growth, safety). Missing pillars score at median standing so thin coverage cannot inflate the rank. Dropping 37 places versus 2022 (#105 → #142).

Latest owned placements: indoor radon rank #137 of 327 at 106 Bq/m³ survey mean; residential mill rate rank #37 of 57 (12.26 mill rate). Full tables and method notes live on each study edition; atlas readings for the same slug open from the topic buttons.

Against the national corpus, Centre Wellington carries a City Score standing of 52% (rank #142 of 343) with 6 of 8 pillars observed. That sits 1 points below the Ontario peer average across 123 ranked cities. Within Ontario, Centre Wellington ranks #69 of 123 on City Score.

The strongest signal in the current chart is broadband download (ISED seed tier) (standing 68%, rank #112 of 343, raw score 788.2). The weakest observed pillar is drinking-water hardness (standing 20%, rank #69 of 343).

Drinking-water hardness on the water atlas reads 229 mg/L as CaCO₃ for Centre Wellington. Compare that figure to the hardness pillar on the chart and to the national hardness guide on the hub.
#142
Arena rank (of 343)
52%
City Score
6
Pillars observed
Dropping−37
vs 2022
#105 → #142

Arena loadout

Topic XP bars

Arena rank #142 of 343

City Score

6/8 pillars · main XP bar

52%#142
Drinking water

Pillar avg · hardness #69

26%
Building permits

No placement

—
Internet

Rank #112

68%
Radon

Rank #137

42%
Hazards

Rank #197

57%
Property tax

Rank #37

65%

Centre Wellington pillar standing

Eight equal-weight City Score pillars, 2025 panel year.

TaxPermitsNetRadonWaterHazardsGrowthCrime

Source: OpenStats composite / study editions

City Score standing trend

Standing percentage by panel year (higher is better).

Years: 2016, 2017, 2018, 2019, 2020, 2021, 2022, 2023, 2024, 2025

Source: OpenStats composite timeseries

Achievements

Dropping -37Groundwater supply

Hometown notes

City profile

Older hometown notes stay on the desk archive (noindex) — this section shows recent highlights only.

Centre Wellington in brief

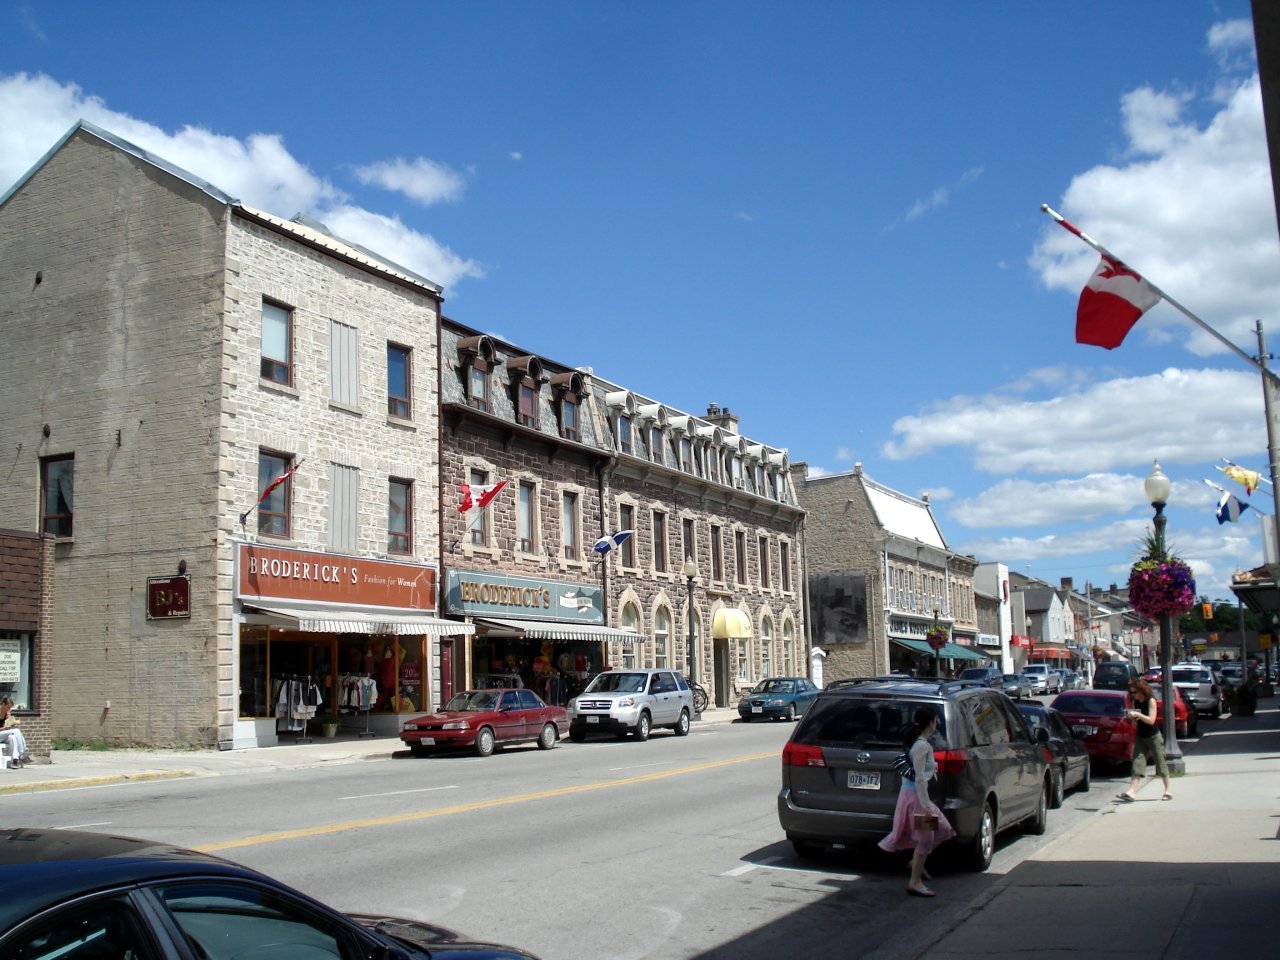
Centre Wellington is the municipal name. Elora and Fergus are what people actually say. Township Explore CW pages sell the pair as heritage towns on dramatic cliffs and water, with Salem tucked onto the tourist maps and an Elora & Fergus Tourism desk at 10 East Mill Street. Wellington Advertiser shorthand simply calls the place CW when the mayoral race heats up. Separate downtowns, shared roads, and a visitor industry that treats a getaway afternoon as one loop through both cores.

Elora's self-guided walk sends you across the Jack R. MacDonald Pedestrian Bridge, past the Elora mill on West Mill Street, and up to Victoria Park for Upper Grand Gorge Trail views of the Tooth of Time and Lover's Leap, where the Grand River meets Irvine Creek. Downtown Fergus answers with the Pipes, Plaid and Pageantry Parade, the Fergus Grand Theatre tourism desk, and a business beat that still talks about the Nexans Fergus cable plant. The gorge draws the cameras; the cable plant and council races keep the township grounded.

Arts fill the calendar between the gorge and the parade. Elora Centre for the Arts runs Open Sky Live summer concerts, the Elora Sculpture Project lines Mill Street from May to October, and the Elora Fergus Studio Tour opens workshops in the fall. Wellington County Museum & Archives adds its own summer concert series. On OpenStats City Score for 2025, Centre Wellington sits at rank 244 of 343. The local frame stays Elora, Fergus, and the Grand.

Drawn from Township of Centre Wellington - Explore CW, Township of Centre Wellington - Tour Centre Wellington, Township of Centre Wellington - Elora & Fergus Tourism, Wellington Advertiser.

City Score over time

City Score from 2016–2025 across eight open-data pillars. Individual study placements are listed in the panels below.

0%25%50%75%100%2016201720182019202020212022202320242025
OpenStats City Score

Rankings for Centre Wellington

Each study below is its own ranking. Where a study has more than one edition for this city, the chart shows standing across those years only.

Safety · OpenStats

Crime severity not placed

Statistics Canada does not publish a police-service Crime Severity Index that OpenStats can match to Centre Wellington without copying a province, CMA, or another city. The safety pillar scores at median standing (50%) on City Score, the same rule used for other missing pillars.

Connectivity · OpenStats

OpenStats Broadband Download Speeds

OpenStats

Cities ranked by household-weighted maximum advertised download (Mbps) from ISED National Broadband Data hex ISP rows, with hex-to-city assignment by population-weighted gravity. The headline 2025 score is the dwelling-weighted mean of per-hex technology ceilings (fibre and cable at 1 Gbps, DSL lower). Household-weighted 50/10 availability (%) is stored on atlas rows as avail_5010_pct. Earlier panel years backcast along a national speed curve with city-specific fiber and availability paths.

10 editions · 2016–2025

#112
Latest · 2025 · of 343
Score 788.2

Composite · OpenStats

OpenStats City Score

OpenStats

Dimensional average of OpenStats open-data pillars for each panel year 2016-2025: tax, construction, connectivity, indoor air, water, seismic hazard, population growth, and crime severity. Each series is scored 0-1 within its edition; series in the same pillar are averaged, then all eight pillars are averaged with equal weight. Missing pillars score at median standing (0.5). Crime severity uses StatCan police-service CSI only (Tables 35-10-0026-01 and 35-10-0063-01); cities without a police-service match take median standing on the safety pillar. Growth uses StatCan CSD estimates; construction uses verified municipal building-permit value per resident (population field on each city record, 2021 Census vintage); mill rates and broadband use live rows plus documented year-varying estimates where needed. Radon, water, and PGA may be survey/model vintages carried forward and are flagged when static for more than two years. External commercial livability lists are never inputs.

10 editions · 2016–2025

#142
Latest · 2025 · of 343
Score 0.518

Water · OpenStats

OpenStats Drinking Water Hardness

OpenStats

Communities ranked by municipal drinking-water hardness (mg/L as CaCO₃). Hardness changes slowly; the atlas vintage is carried across panel years and flagged when static for more than two years.

10 editions · 2016–2025

#69
Latest · 2025 · of 343
Score 229

Health · OpenStats

OpenStats Highest Indoor Radon

OpenStats

Communities ranked by Health Canada survey mean indoor radon (Bq/m³). Rank 1 is the highest mean. Decade panel years without a new survey carry the CMA survey vintage forward; they are not annual retests.

10 editions · 2016–2025

#137
Latest · 2025 · of 327
Score 105.5

Growth · OpenStats

OpenStats Population Growth

OpenStats

Cities ranked by year-over-year population growth from Statistics Canada annual CSD estimates (Table 17-10-0155-01). Rank 1 is fastest growth. A few places without a clean CSD match use a provincial-path estimate anchored to seed population.

10 editions · 2016–2025

#151
Latest · 2025 · of 343
Score 0.012478397141099622

Property tax · OpenStats

OpenStats Residential Mill Rates

OpenStats

Municipalities ranked by residential mill rate (education levies are shown on property-tax pages but not added here). Rank 1 is the highest rate. Atlas seed and published municipal rows anchor the panel; off-panel tax years (e.g. 2026) carry across 2016–2025; remaining gaps follow provincial paths.

10 editions · 2016–2025

#37
Latest · 2025 · of 57
Score 12.26

Hazards · OpenStats

OpenStats Seismic Hazard (PGA)

OpenStats

Communities ranked by NRCan peak ground acceleration (higher = stronger shaking hazard). Rank 1 is highest PGA. The seismic model is multi-year; values are carried across the City Score panel and flagged as static until NRCan publishes a new generation.

10 editions · 2016–2025

#197
Latest · 2025 · of 343
Score 0.041

Livability

Globe and Mail Most Livable Cities

The Globe and Mail

2023 data partnership with Environics Analytics ranking 439 Canadian communities on ten livability categories.

Single edition · 2023

#76
Published · 2023 · of 439

Only one published edition places Centre Wellington in this study so far. Open the edition for method notes and the full table.

Original source · Full edition

Worth knowing in Centre Wellington

Distinctive local notes and places, each linked to its source.

Places to see

Elora Gorge / Upper Grand Gorge Trail

Victoria Park access leads to gorge views, the Tooth of Time, and Lover's Leap above the meeting of the Grand River and Irvine Creek. It is the outdoors reason people drive to Elora.

Elora mill and West Mill Street

The mill at the end of West Mill Street anchors the limestone commercial core. The Jack R. MacDonald Pedestrian Bridge gives the postcard river crossing a few steps away.

Elora Centre for the Arts

Home base for Open Sky Live summer concerts and a steady arts calendar that pairs with the Elora Sculpture Project downtown.

Follow Centre Wellington by email

When Centre Wellington moves in a ranking, posts new permit figures, or lands in a study, get a short note. A few sends a year, only when something changes.

No spam. Unsubscribe with one reply.

Related guides

More places in Ontario

All Ontario cities