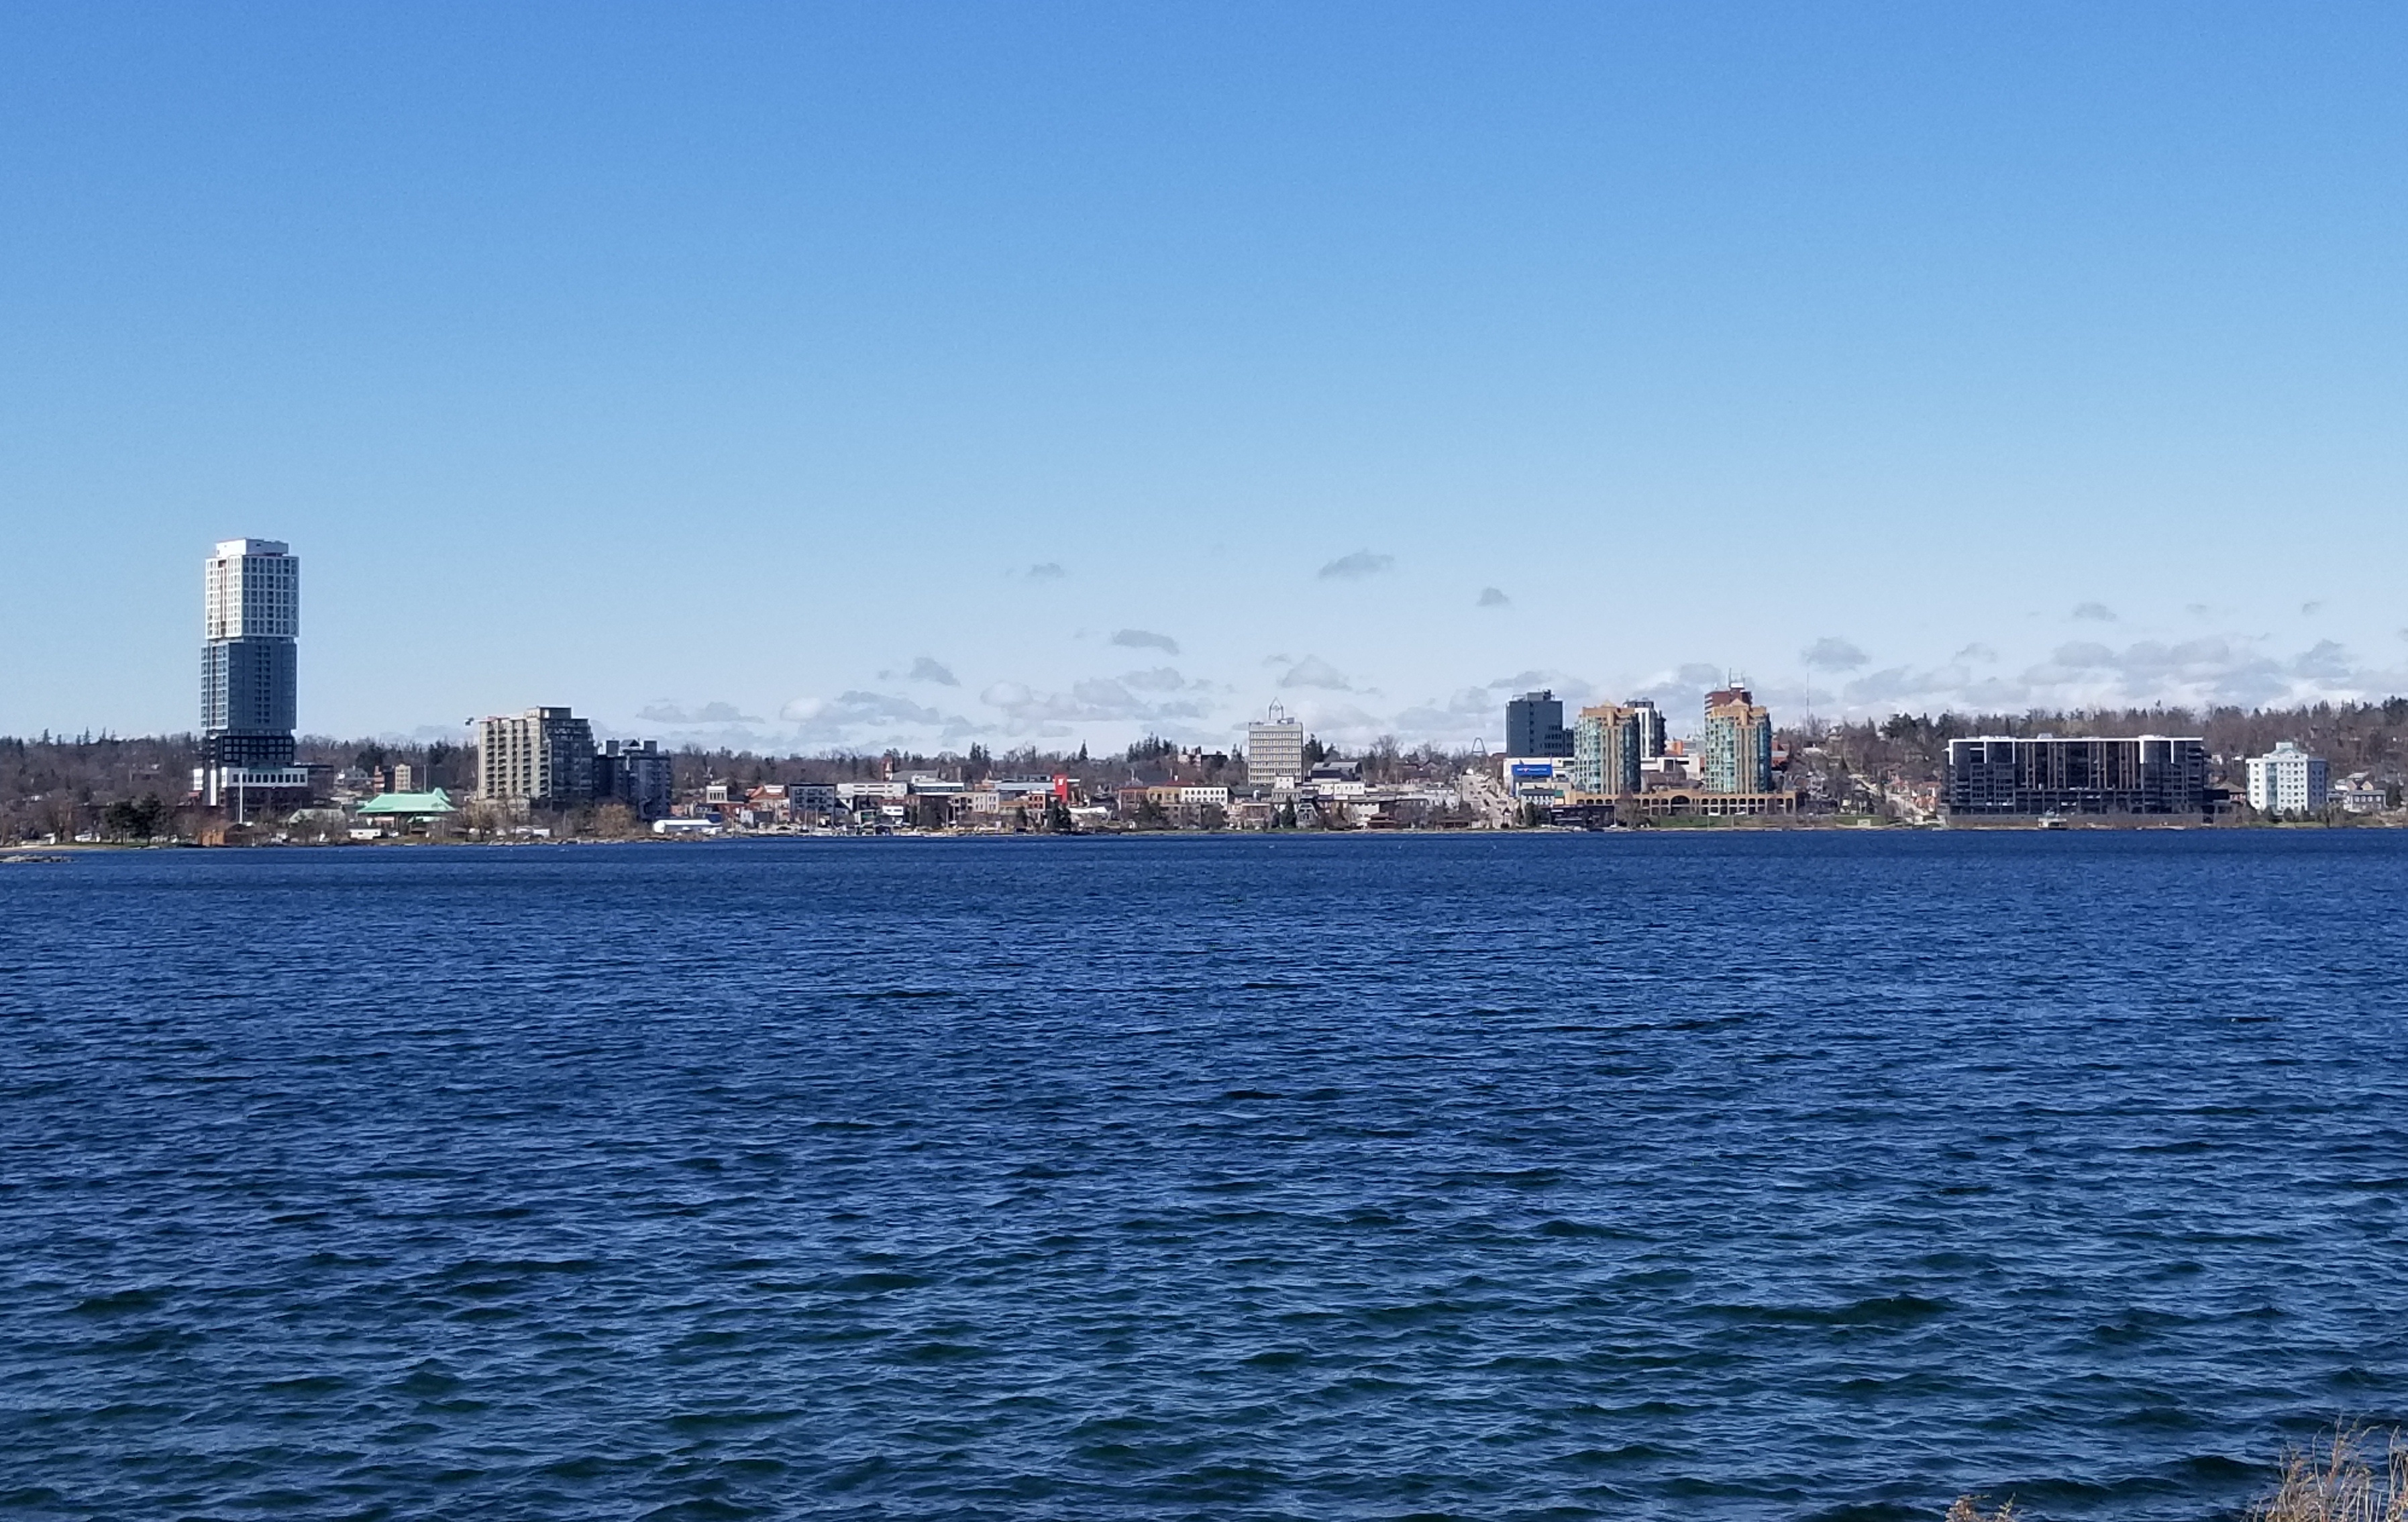
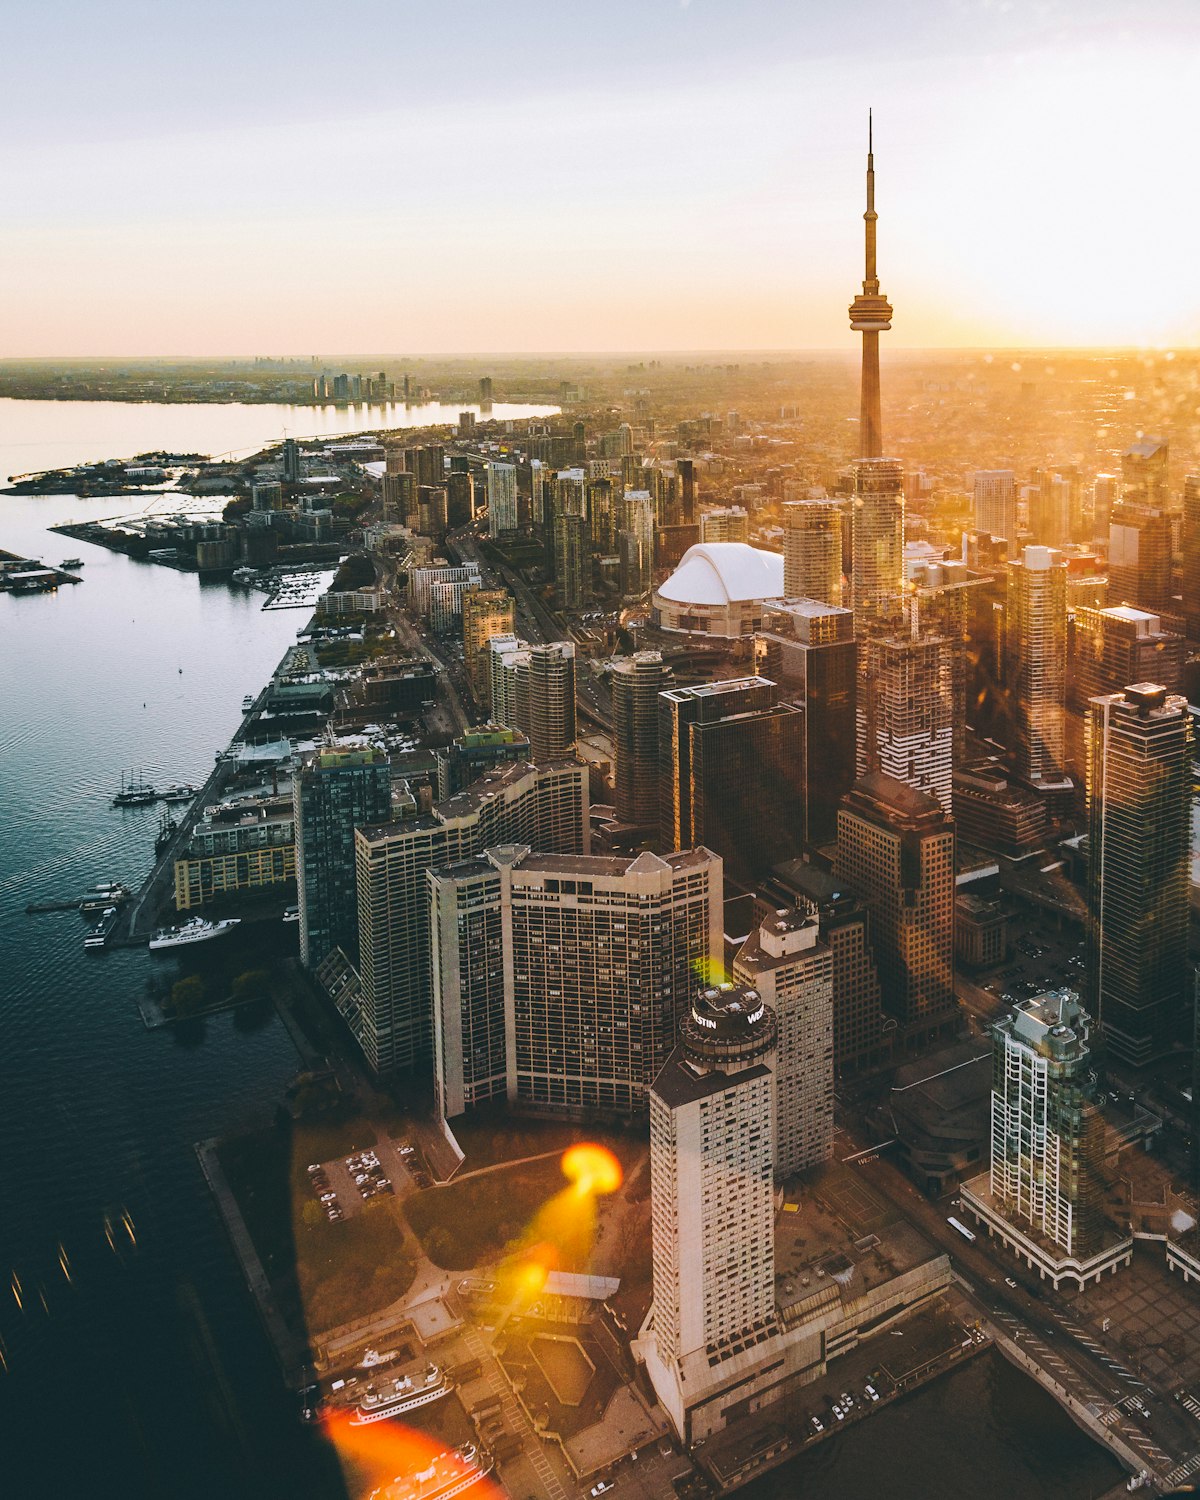
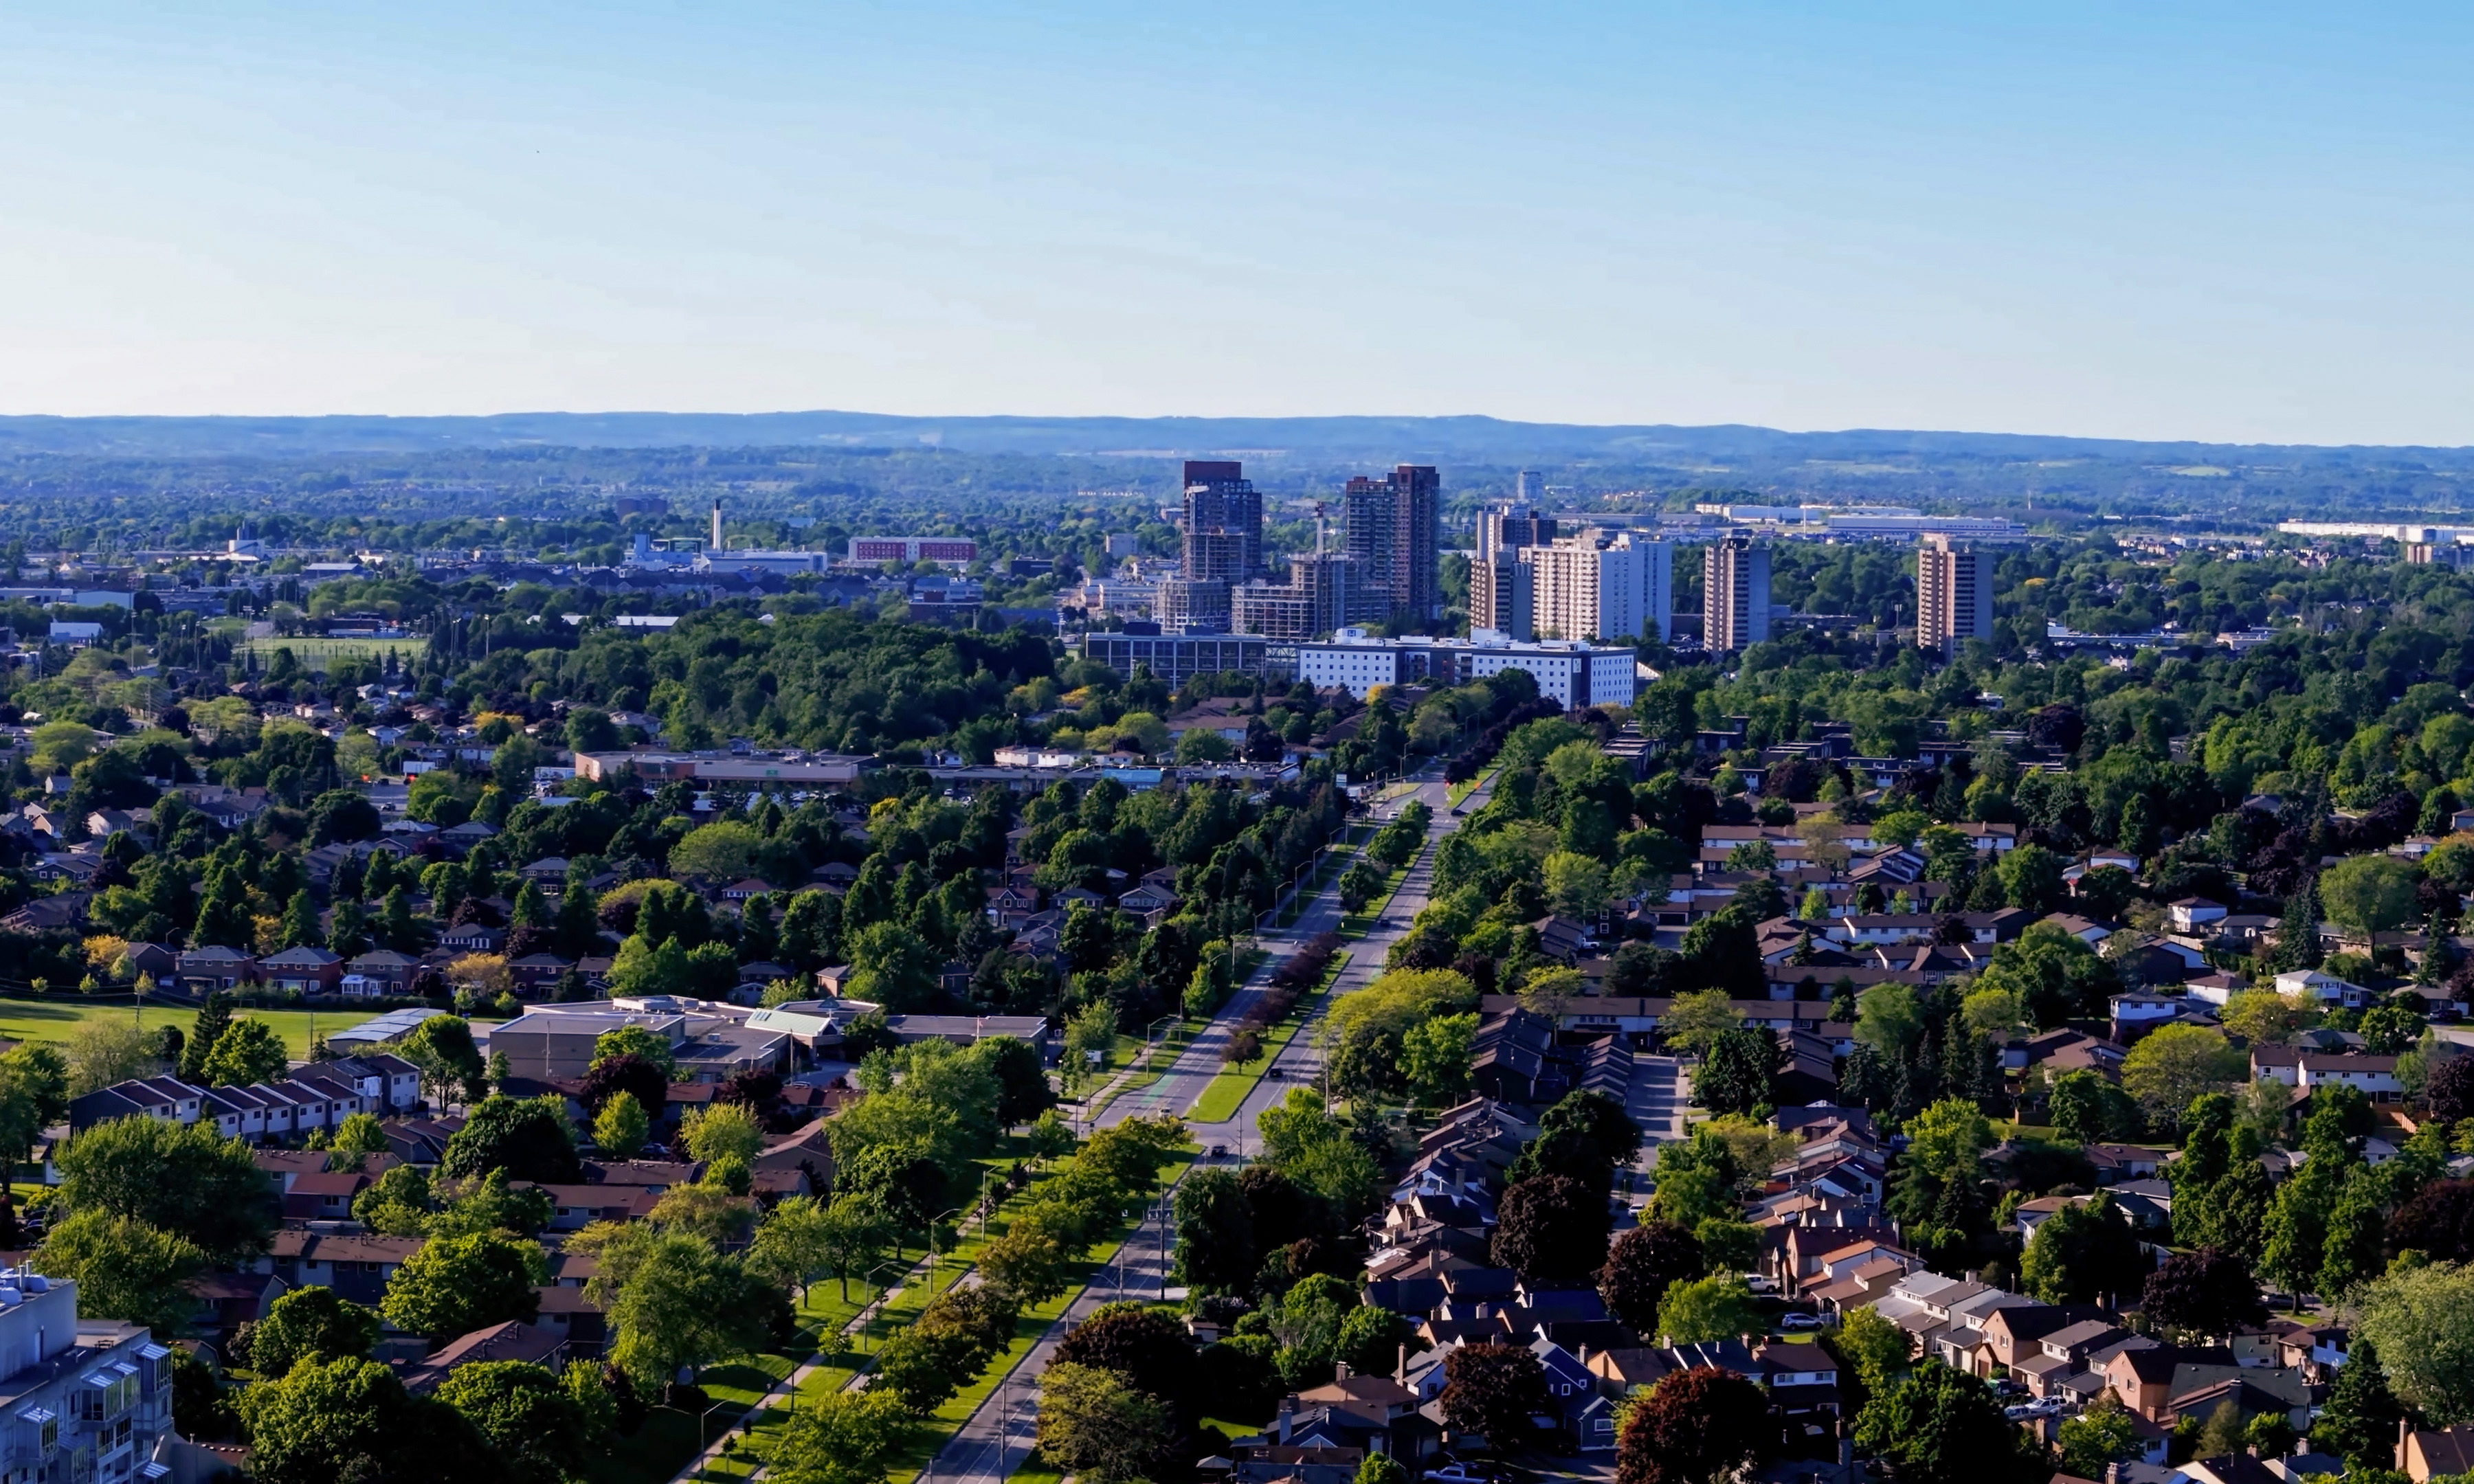
Toronto skyline
Unsplash

Ontario · Civic arena

Toronto

Toronto drinking water hardness is 121 mg/L on OpenStats, plus City Score rankings and local readings.

Civic arena · hometown HUD

Toronto

City2.8M pop
62XP
#23

#23 of 343

62% City Score XP

8/8 pillarsDroppingDirectSurface
City Score XP

8/8 pillars on the board

62%#23

Decade trail

Toronto packs 8 of eight open-data pillars into its composite standing. Tap a rival below to see how the hometown stacks up head-to-head.

Toronto drinking water

Direct municipal reading

Hardness, pH, and lead from municipal reports on the OpenStats water atlas.

Hardness
121 mg/L
hard
pH
7.5
Lead
0.5 μg/L

Full Toronto water quality report →City Score rankingsCompare cities · vs Tillsonburg · vs EssaHardness guide

Watershed to tap · system map

How Toronto's water works

Source, treatment, and distribution for Toronto from municipal and provincial water records. Open the animated map for the full watershed-to-tap diagram — no nested topic navigation here.

Local numbers for Toronto

Permits, tax, internet, radon, hazards, drinking water, and sports rankings where a CHL hometown applies.

How Toronto scores

Dropping−22

Toronto sits at City Score rank #23 with a standing of 62%, from 8 of 8 open-data pillars (tax, construction, connectivity, indoor air, water, seismic hazard, growth, safety). Missing pillars score at median standing so thin coverage cannot inflate the rank. Dropping 22 places versus 2022 (#1 → #23).

Latest owned placements: building permit value rank #11 of 25 (2025); indoor radon rank #277 of 327 at 60 Bq/m³ survey mean; residential mill rate rank #53 of 57 (7.46 mill rate). Full tables and method notes live on each study edition; atlas readings for the same slug open from the topic buttons.

On the latest OpenStats pass, Toronto carries a City Score standing of 62% (rank #23 of 343) with 8 of 8 pillars observed. That sits 9 points above the Ontario peer average across 123 ranked cities. Within Ontario, Toronto ranks #16 of 123 on City Score.

The strongest signal in the current chart is property tax (standing 93%, rank #53 of 57, raw score 7.46). The weakest observed pillar is population growth (standing 12%, rank #302 of 343). Crime severity uses the Statistics Canada police-service CSI mapped to Toronto, Ontario (table 35100026), not a regional proxy.

Drinking-water hardness on the water atlas reads 121 mg/L as CaCO₃ for Toronto. Compare that figure to the hardness pillar on the chart and to the national hardness guide on the hub.
#23
Arena rank (of 343)
62%
City Score
8
Pillars observed
Dropping−22
vs 2022
#1 → #23

Arena loadout

Topic XP bars

Arena rank #23 of 343

City Score

8/8 pillars · main XP bar

62%#23
Drinking water

Pillar avg · hardness #258

56%
Building permits

Rank #11

60%
Internet

Rank #75

78%
Radon

Rank #277

85%
Hazards

Rank #106

31%
Property tax

Rank #53

93%

Toronto pillar standing

Eight equal-weight City Score pillars, 2025 panel year.

TaxPermitsNetRadonWaterHazardsGrowthCrime

Source: OpenStats composite / study editions

City Score standing trend

Standing percentage by panel year (higher is better).

Years: 2016, 2017, 2018, 2019, 2020, 2021, 2022, 2023, 2024, 2025

Source: OpenStats composite timeseries

Achievements

Full pillar coverageDropping -22Direct municipal readingSurface water supply

In the news

Data desk

Hometown notes

City profile

Older hometown notes stay on the desk archive (noindex) — this section shows recent highlights only.

Toronto in brief

Toronto is the GTA's core city, and the first orientation tricks are still the simplest. Toronto Island & Ferries pull you off the harbour for a day of shoreline and skyline; City pages call the Island one of the most beloved parks, with Centre Island dock logistics and summer ticket rules that regulars already know. Back on the mainland, High Park holds the west-end green lung with Grenadier Café and Colborne Lodge on the municipal map. East along the waterfront restoration story, Biidaasige Park sits at the mouth of the Don River on Ookwemin Minising near Cherry Street. Ravines and ten designated swimming beaches fill out the parks grammar between those anchors.

Commute talk is TTC talk. Line 1 Yonge-University is the north-south spine named on service boards; streetcars and the Blue Night Network cover the hours when the subway sleeps. When something civic breaks, 311 is the number on toronto.ca. Nathan Phillips Square is the downtown lawn for Cavalcade of Lights, Taste of India, and the festival stack the City produces with local artists: Nuit Blanche, Summerlicious, Doors Open, Pride Month. Neighbourhood names from daily news (St. James Town, Scarborough, Downsview) remind you the core city is a federation of districts, not a single postcard.

CBC Toronto fronts swing from housing density fights to Blue Jays and Maple Leafs business, which is also a kind of local weather. CampTO and Emancipation Month show up on the City home carousel because summer programming is civic work here. On the OpenStats City Score for 2025, Toronto sits at rank 42 of 343, with building-permit value at rank 42 of 343. Rankings aside, the hometown read is ferry queues, Line 1 delays, and Nathan Phillips Square when the city wants to see itself outdoors.

Drawn from City of Toronto, Toronto Island & Ferries, City of Toronto festivals, TTC, CBC Toronto.

City Score over time

City Score from 2016–2025 across eight open-data pillars. Individual study placements are listed in the panels below.

0%25%50%75%100%2016201720182019202020212022202320242025
OpenStats City Score

Rankings for Toronto

Each study below is its own ranking. Where a study has more than one edition for this city, the chart shows standing across those years only.

Connectivity · OpenStats

OpenStats Broadband Download Speeds

OpenStats

Cities ranked by household-weighted maximum advertised download (Mbps) from ISED National Broadband Data hex ISP rows, with hex-to-city assignment by population-weighted gravity. The headline 2025 score is the dwelling-weighted mean of per-hex technology ceilings (fibre and cable at 1 Gbps, DSL lower). Household-weighted 50/10 availability (%) is stored on atlas rows as avail_5010_pct. Earlier panel years backcast along a national speed curve with city-specific fiber and availability paths.

10 editions · 2016–2025

#75
Latest · 2025 · of 343
Score 949.7

Construction · OpenStats

OpenStats Building Permit Value per Resident

OpenStats

Cities ranked by calendar-year municipal building permit value per resident (total permit dollars divided by the OpenStats population field). Permit totals use verified municipality-grain rows (Statistics Canada CSD or equivalent municipal open data). Population uses Statistics Canada Census 2021 (tables 98-10-0006-01, 98-10-0002-01). Cities without a verified municipal permit series are unplaced; City Score uses median standing on the construction pillar.

2 editions · 2024–2025

#11
Latest · 2025 · of 25
Score 4074.501477777778

Composite · OpenStats

OpenStats City Score

OpenStats

Dimensional average of OpenStats open-data pillars for each panel year 2016-2025: tax, construction, connectivity, indoor air, water, seismic hazard, population growth, and crime severity. Each series is scored 0-1 within its edition; series in the same pillar are averaged, then all eight pillars are averaged with equal weight. Missing pillars score at median standing (0.5). Crime severity uses StatCan police-service CSI only (Tables 35-10-0026-01 and 35-10-0063-01); cities without a police-service match take median standing on the safety pillar. Growth uses StatCan CSD estimates; construction uses verified municipal building-permit value per resident (population field on each city record, 2021 Census vintage); mill rates and broadband use live rows plus documented year-varying estimates where needed. Radon, water, and PGA may be survey/model vintages carried forward and are flagged when static for more than two years. External commercial livability lists are never inputs.

10 editions · 2016–2025

#23
Latest · 2025 · of 343
Score 0.617

Safety · OpenStats

OpenStats Crime Severity Index

OpenStats

Communities ranked by Statistics Canada Crime Severity Index at police-service grain (Tables 35-10-0026-01 and 35-10-0063-01 for British Columbia). Rank 1 is highest CSI (worse). Cities without a police-service match are not listed; the safety pillar scores at median standing on City Score. Hometown pages name the police service and reference year.

CSI from Toronto, Ontario (2025, Table 35-10-0026-01).

10 editions · 2016–2025

#80
Latest · 2025 · of 102
Score 54.99

Water · OpenStats

OpenStats Drinking Water Hardness

OpenStats

Communities ranked by municipal drinking-water hardness (mg/L as CaCO₃). Hardness changes slowly; the atlas vintage is carried across panel years and flagged when static for more than two years.

10 editions · 2016–2025

#258
Latest · 2025 · of 343
Score 121

Health · OpenStats

OpenStats Highest Indoor Radon

OpenStats

Communities ranked by Health Canada survey mean indoor radon (Bq/m³). Rank 1 is the highest mean. Decade panel years without a new survey carry the CMA survey vintage forward; they are not annual retests.

10 editions · 2016–2025

#277
Latest · 2025 · of 327
Score 59.7

Growth · OpenStats

OpenStats Population Growth

OpenStats

Cities ranked by year-over-year population growth from Statistics Canada annual CSD estimates (Table 17-10-0155-01). Rank 1 is fastest growth. A few places without a clean CSD match use a provincial-path estimate anchored to seed population.

10 editions · 2016–2025

#302
Latest · 2025 · of 343
Score -0.00261765501154274

Property tax · OpenStats

OpenStats Residential Mill Rates

OpenStats

Municipalities ranked by residential mill rate (education levies are shown on property-tax pages but not added here). Rank 1 is the highest rate. Atlas seed and published municipal rows anchor the panel; off-panel tax years (e.g. 2026) carry across 2016–2025; remaining gaps follow provincial paths.

10 editions · 2016–2025

#53
Latest · 2025 · of 57
Score 7.46

Hazards · OpenStats

OpenStats Seismic Hazard (PGA)

OpenStats

Communities ranked by NRCan peak ground acceleration (higher = stronger shaking hazard). Rank 1 is highest PGA. The seismic model is multi-year; values are carried across the City Score panel and flagged as static until NRCan publishes a new generation.

10 editions · 2016–2025

#106
Latest · 2025 · of 343
Score 0.077

Housing

CMHC Average 2-Bedroom Rent — Lowest Rent

Canada Mortgage and Housing Corporation

Average rent for purpose-built 2-bedroom apartments (all tenants) from CMHC Rental Market Survey. Rank 1 = lowest average rent among covered CMAs.

Single edition · 2025

#16
Published · 2025 · of 18
Score 2034

Only one published edition places Toronto in this study so far. Open the edition for method notes and the full table.

Original source · Full edition

Housing

CMHC Purpose-Built Rental Vacancy — Highest Vacancy

Canada Mortgage and Housing Corporation

Purpose-built rental apartment vacancy rate from CMHC Rental Market Survey (October). Rank 1 = highest vacancy (most available rental stock among covered CMAs).

Single edition · 2025

#12
Published · 2025 · of 18
Score 3

Only one published edition places Toronto in this study so far. Open the edition for method notes and the full table.

Original source · Full edition

Livability

Globe and Mail Most Livable Cities

The Globe and Mail

2023 data partnership with Environics Analytics ranking 439 Canadian communities on ten livability categories.

Single edition · 2023

#64
Published · 2023 · of 439

Only one published edition places Toronto in this study so far. Open the edition for method notes and the full table.

Original source · Full edition

Worth knowing in Toronto

Distinctive local notes and places, each linked to its source.

  • City ferry pages treat Toronto Island as a long-standing public park day trip from the harbour, with advance tickets encouraged in peak season.

    City of Toronto

  • TTC service boards name Line 1 Yonge-University as the primary north-south subway, with Blue Night Network covering overnight routes.

    TTC

  • Nathan Phillips Square hosts City festival fixtures such as Cavalcade of Lights and events like Taste of India on the civic square.

    City of Toronto

  • Biidaasige Park is described on City pages as sitting near Cherry Street on Ookwemin Minising at the mouth of the Don River.

    City of Toronto

Places to see

Toronto Island

Ferry-accessed park with Lake Ontario on one side and the downtown skyline on the other. Centre Island dock culture is summer Toronto in miniature.

High Park

Large west-end destination park with Grenadier Café and Colborne Lodge on the City roster. TTC access from Bloor Street West keeps it in weekday reach.

Biidaasige Park

Newer waterfront park at the Don River mouth on Ookwemin Minising. City copy frames it around waterway restoration and reconciliation.

Nathan Phillips Square

Downtown civic square for lights, festivals, and lunch-hour crossings. When Toronto puts on a public face, it often starts here.

Follow Toronto by email

When Toronto moves in a ranking, posts new permit figures, or lands in a study, get a short note. A few sends a year, only when something changes.

No spam. Unsubscribe with one reply.

Related guides

More places in Ontario

All Ontario cities