Nanaimo, British Columbia
Wikimedia Commons via Wikipedia

British Columbia

Nanaimo

OpenStats City Score, ranking history, and local readings for Nanaimo.

Dropping18

City Score #57 (2022) → #75 (2025)

How Nanaimo scores

Dropping18

Nanaimo sits at City Score rank #75 with a standing of 51%, from 8 of 8 open-data pillars (tax, construction, connectivity, indoor air, water, seismic hazard, growth, safety). Missing pillars score at median standing so thin coverage cannot inflate the rank. Dropping 18 places versus 2022 (#57 → #75).

Latest owned placements: building permit value rank #55 of 172 (2025); indoor radon rank #114 of 117 at 35 Bq/m³ survey mean; residential mill rate rank #80 of 172 (11.24 mill rate). Full tables and method notes live on each study edition; atlas readings for the same slug open from the topic buttons.

#75
City Score rank
51%
City Score
Dropping18
vs 2022
#57 → #75

Local readings for Nanaimo

Open each topic for Nanaimo.

See where Nanaimo water comes from

Local sports in Nanaimo

Documented pro, junior, university, and high-school teams tied to Nanaimo.

Hometown notes

Archive

Earlier years: 2026 · 2025 · 2024 · 2023

Nanaimo in brief

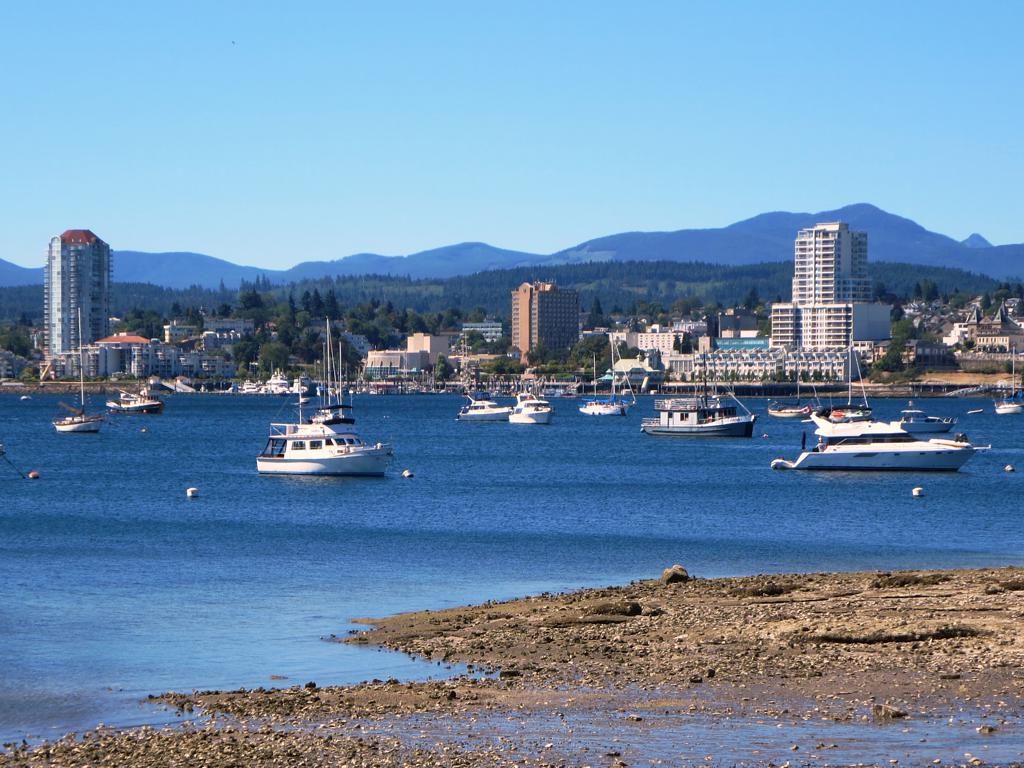
Nanaimo introduces itself as the Harbour City, a mid-Island centre on Snuneymuxw First Nations land where the slogan beat out Hub City even though both still fit. From a BC Ferries deck the town climbs the hill; from downtown the Bastion gets lit for civic colour days while Maffeo Sutton Park holds the waterfront playground and public-art stretch. Saysutchun (Newcastle) Island sits just offshore for kayak days, and Mount Benson marks the western skyline when the sun drops.

People still grin about the Nanaimo Bar Trail, but the municipal About page is quick to stack coal-town, timber-town, and port-town chapters behind the dessert joke. Serauxmen Stadium is marking fifty years of baseball, the Stadium District keeps adding amenities, and Loudon Park and Rotary Bowl show up in the same recreation upgrade beat. The Nanaimo Aquatic Centre and a big parks-and-trails inventory keep island recreation practical year-round, not just brochure-deep.

Nanaimo News Bulletin covers Best of the City votes beside Timbermen lacrosse, Commercial Street Night Market nights, and the usual planning fights over industrial lands. Bathtub Race summer still belongs to the Nanaimo Marine Festival story locals expect visitors to ask about. My Nanaimo This Week keeps the civic drip going between council summaries. Port cargo, two ferry terminals, and short-hop flights keep the hub role real north of the Malahat, while Millstone River imagery shows up even in playground design at Maffeo Sutton. On OpenStats City Score for 2026, Nanaimo sits at rank 73 of 125. The shorthand stays Harbour City, with a Nanaimo Bar for the road.

Drawn from City of Nanaimo - About Nanaimo, City of Nanaimo, Nanaimo News Bulletin, City of Nanaimo - History of Nanaimo.

City Score over time

City Score from 2016–2025 across eight open-data pillars. Individual study placements are listed in the panels below.

0%25%50%75%100%2016201720182019202020212022202320242025
OpenStats City Score

Rankings for Nanaimo

Each study below is its own ranking. Where a study has more than one edition for this city, the chart shows standing across those years only.

sports · OpenStats

OpenStats BCHL Points Percentage

OpenStats

Cities with a British Columbia Hockey League club in the OpenStats seed list ranked by regular-season points percentage. Rank 1 = highest points %. Source: Wikipedia BCHL season standings. Clubs in towns outside the seed list are omitted.

Single edition · 2025

#10
Published · 2025 · of 16
Score 0.574

Only one published edition places Nanaimo in this study so far. Open the edition for method notes and the full table.

Original source · Full edition

Connectivity · OpenStats

OpenStats Broadband Download Speeds

OpenStats

Cities ranked by estimated best advertised download (Mbps). Anchored to the current ISED National Broadband Data vintage, then backcast along a national speed curve with city-specific fiber-arrival and 50/10 availability paths so relative ranks can change over the decade. Not a claim of audited historical hex maps for every year.

10 editions · 2016–2025

#48
Latest · 2025 · of 172
Score 41.5

Construction · OpenStats

OpenStats Building Permit Value

OpenStats

Cities ranked by calendar-year building permit value. Direct rows sum Statistics Canada Table 34-10-0292-01. Cities without a direct reading use population × provincial per-capita permit intensity (estimated), so every seed city has a year-varying construction signal.

10 editions · 2016–2025

#55
Latest · 2025 · of 172
Score 475983000

Composite · OpenStats

OpenStats City Score

OpenStats

Dimensional average of OpenStats open-data pillars for each panel year 2016–2025: tax, construction, connectivity, indoor air, water, seismic hazard, population growth, and crime severity. Each series is scored 0–1 within its edition; series in the same pillar are averaged, then all eight pillars are averaged with equal weight. Missing pillars score at median standing (0.5). Growth and CSI use StatCan annual tables; permits, mill rates, and broadband use live rows plus documented year-varying estimates where needed. Radon, water, and PGA may be survey/model vintages carried forward and are flagged when static for more than two years. External commercial livability lists are never inputs.

10 editions · 2016–2025

#75
Latest · 2025 · of 172
Score 0.515

Safety · OpenStats

OpenStats Crime Severity Index

OpenStats

Communities ranked by Statistics Canada Crime Severity Index (Table 35-10-0026-01). Rank 1 is highest CSI (worse). Values are CMA where a metro match exists, otherwise provincial CSI. Hometown pages label the grain.

10 editions · 2016–2025

#64
Latest · 2025 · of 172
Score 83.51

Water · OpenStats

OpenStats Drinking Water Hardness

OpenStats

Communities ranked by municipal drinking-water hardness (mg/L as CaCO₃). Hardness changes slowly; the atlas vintage is carried across panel years and flagged when static for more than two years.

10 editions · 2016–2025

#121
Latest · 2025 · of 172
Score 127

Health · OpenStats

OpenStats Highest Indoor Radon

OpenStats

Communities ranked by Health Canada survey mean indoor radon (Bq/m³). Rank 1 is the highest mean. Decade panel years without a new survey carry the CMA survey vintage forward; they are not annual retests.

10 editions · 2016–2025

#114
Latest · 2025 · of 117
Score 35.4

sports · OpenStats

OpenStats Local Sports Depth

OpenStats

Cities ranked by weighted count of documented local teams (pro, junior, university, high-school hubs). Rank 1 = deepest documented sports footprint among covered seed cities. Not a claim about on-field success. See sports methodology for weights and gaps.

Single edition · 2025

#46
Published · 2025 · of 172
Score 5

Only one published edition places Nanaimo in this study so far. Open the edition for method notes and the full table.

Original source · Full edition

Growth · OpenStats

OpenStats Population Growth

OpenStats

Cities ranked by year-over-year population growth from Statistics Canada annual CSD estimates (Table 17-10-0155-01). Rank 1 is fastest growth. A few places without a clean CSD match use a provincial-path estimate anchored to seed population.

10 editions · 2016–2025

#87
Latest · 2025 · of 172
Score 0.011439681678422861

Property tax · OpenStats

OpenStats Residential Mill Rates

OpenStats

Municipalities ranked by residential mill rate. Rank 1 is the highest rate. Published municipal years are used when available; gaps are interpolated or follow the provincial median path so the tax pillar moves year to year for every city.

10 editions · 2016–2025

#80
Latest · 2025 · of 172
Score 11.237959222427664

Hazards · OpenStats

OpenStats Seismic Hazard (PGA)

OpenStats

Communities ranked by NRCan peak ground acceleration (higher = stronger shaking hazard). Rank 1 is highest PGA. The seismic model is multi-year; values are carried across the City Score panel and flagged as static until NRCan publishes a new generation.

10 editions · 2016–2025

#5
Latest · 2025 · of 172
Score 0.315

Livability

Maclean's Best Communities

Maclean's

Successor-style municipal livability ranking published by Maclean's for 2019 and 2021 (no 2020 edition).

Single edition · 2021

#57
Published · 2021 · of 415

Only one published edition places Nanaimo in this study so far. Open the edition for method notes and the full table.

Original source · Full edition

Quality of life

Numbeo Quality of Life Index by City

Numbeo

Crowd-sourced composite Quality of Life Index. Historical snapshots are free on Numbeo ranking pages; OpenStats cites Canadian cities from those public pages (cite_only). Higher index scores are better; ranks are global position on the snapshot page.

Single edition · 2026

#66
Published · 2026 · of 304
Score 185.6

Only one published edition places Nanaimo in this study so far. Open the edition for method notes and the full table.

Original source · Full edition

Worth knowing in Nanaimo

Distinctive local notes and places, each linked to its source.

Places to see

Maffeo Sutton Park

Destination waterfront park with an accessible playground and rotating public art. It is the easy meet-up when guests arrive off the ferry.

Bastion

Downtown landmark the city lights in civic colours for awareness days and holidays. A quick orientation point if you are new to the harbour edge.

Saysutchun (Newcastle) Island

Harbour island day trip by boat or kayak, named in city lifestyle copy beside Mount Benson climbs. A short hop that still feels like leaving town.

Serauxmen Stadium

Long-running baseball grounds in the Stadium District, now marking a half-century of community sport. Locals treat it as more than a diamond.

Follow Nanaimo by email

When Nanaimo moves in a ranking, posts new permit figures, or lands in a study, get a short note. A few sends a year, only when something changes.

No spam. Unsubscribe with one reply.

Related guides

More places in British Columbia

All British Columbia cities