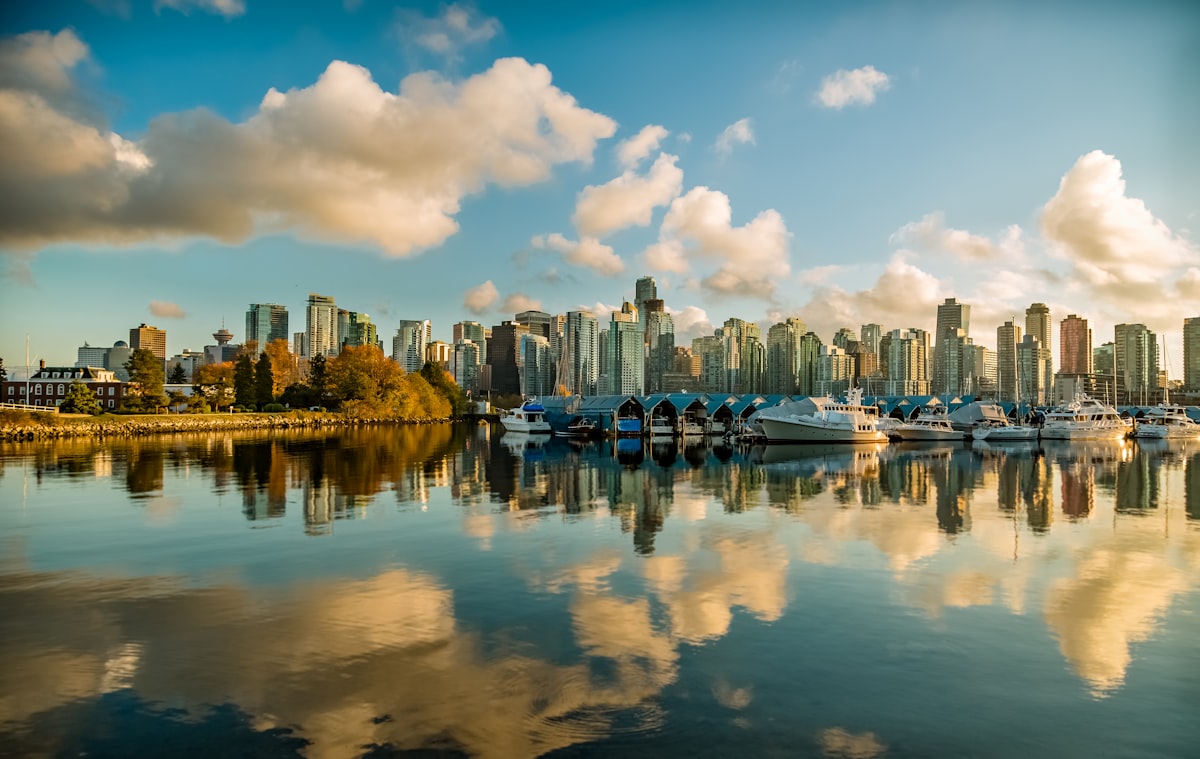
Vancouver harbour
Unsplash

British Columbia

Vancouver

OpenStats City Score, ranking history, and local readings for Vancouver.

Dropping17

City Score #15 (2022) → #32 (2025)

How Vancouver scores

Dropping17

Vancouver sits at City Score rank #32 with a standing of 59%, from 8 of 8 open-data pillars (tax, construction, connectivity, indoor air, water, seismic hazard, growth, safety). Missing pillars score at median standing so thin coverage cannot inflate the rank. Dropping 17 places versus 2022 (#15 → #32).

Latest owned placements: building permit value rank #2 of 172 (2025); indoor radon rank #109 of 117 at 35 Bq/m³ survey mean; residential mill rate rank #77 of 172 (11.39 mill rate). Full tables and method notes live on each study edition; atlas readings for the same slug open from the topic buttons.

#32
City Score rank
59%
City Score
Dropping17
vs 2022
#15 → #32

Local readings for Vancouver

Open each topic for Vancouver.

See where Vancouver water comes from

Local sports in Vancouver

Documented pro, junior, university, and high-school teams tied to Vancouver.

6 more Vancouver teams

Hometown notes

Archive

Earlier years: 2026 · 2025 · 2024 · 2023

Vancouver in brief

Vancouver organizes itself as a mainland metro first. TransLink's SkyTrain lines do the orientation work: Expo Line out through Burnaby, New Westminster, and Surrey; Millennium Line across East Vancouver toward Port Moody and Coquitlam; Canada Line down to Richmond and YVR. Waterfront Station is the downtown rail hinge people name without a map. Compass Cards cover the fare talk, and Broadway Subway construction keeps the Broadway–City Hall corridor in a permanent state of temporary bus stops.

Regional life sits under Metro Vancouver rules as often as city slogans. Stage 2 water restrictions and air-quality notices arrive as regional services, not tourist brochure weather. On the local desk, the Vancouver Sun keeps Gastown restaurants, heat-wave cooling maps, and below-market housing fights on the same front as Canucks and Whitecaps copy. B.C. Place shows up whenever stadium ownership or public-asset talk returns. SeaWheeze brings a half marathon and Sunset Festival into the summer calendar without pretending the city is quiet.

North Shore swim clubs chasing pool time are a reminder that Vancouver's story spills across bridges and inlets, not ferry schedules. Compass Card reloads and Expo Line weekend disruptions are ordinary commute talk here. This is a SkyTrain-and-stadium coastal metro: rail lines, regional water rules, and mainland sports brands. On the OpenStats City Score for 2026, Vancouver sits at rank 4 of 125. Rankings aside, the hometown tell is Expo, Millennium, and Canada Line language across Metro Vancouver, not hanging baskets and Mile 0.

Drawn from TransLink, TransLink SkyTrain, Metro Vancouver, Vancouver Sun.

City Score over time

City Score from 2016–2025 across eight open-data pillars. Individual study placements are listed in the panels below.

0%25%50%75%100%2016201720182019202020212022202320242025
OpenStats City Score

Rankings for Vancouver

Each study below is its own ranking. Where a study has more than one edition for this city, the chart shows standing across those years only.

Connectivity · OpenStats

OpenStats Broadband Download Speeds

OpenStats

Cities ranked by estimated best advertised download (Mbps). Anchored to the current ISED National Broadband Data vintage, then backcast along a national speed curve with city-specific fiber-arrival and 50/10 availability paths so relative ranks can change over the decade. Not a claim of audited historical hex maps for every year.

10 editions · 2016–2025

#9
Latest · 2025 · of 172
Score 58.9

Construction · OpenStats

OpenStats Building Permit Value

OpenStats

Cities ranked by calendar-year building permit value. Direct rows sum Statistics Canada Table 34-10-0292-01. Cities without a direct reading use population × provincial per-capita permit intensity (estimated), so every seed city has a year-varying construction signal.

10 editions · 2016–2025

#2
Latest · 2025 · of 172
Score 16220132000

Composite · OpenStats

OpenStats City Score

OpenStats

Dimensional average of OpenStats open-data pillars for each panel year 2016–2025: tax, construction, connectivity, indoor air, water, seismic hazard, population growth, and crime severity. Each series is scored 0–1 within its edition; series in the same pillar are averaged, then all eight pillars are averaged with equal weight. Missing pillars score at median standing (0.5). Growth and CSI use StatCan annual tables; permits, mill rates, and broadband use live rows plus documented year-varying estimates where needed. Radon, water, and PGA may be survey/model vintages carried forward and are flagged when static for more than two years. External commercial livability lists are never inputs.

10 editions · 2016–2025

#32
Latest · 2025 · of 172
Score 0.587

Safety · OpenStats

OpenStats Crime Severity Index

OpenStats

Communities ranked by Statistics Canada Crime Severity Index (Table 35-10-0026-01). Rank 1 is highest CSI (worse). Values are CMA where a metro match exists, otherwise provincial CSI. Hometown pages label the grain.

10 editions · 2016–2025

#70
Latest · 2025 · of 172
Score 83.51

Water · OpenStats

OpenStats Drinking Water Hardness

OpenStats

Communities ranked by municipal drinking-water hardness (mg/L as CaCO₃). Hardness changes slowly; the atlas vintage is carried across panel years and flagged when static for more than two years.

10 editions · 2016–2025

#169
Latest · 2025 · of 172
Score 22

Health · OpenStats

OpenStats Highest Indoor Radon

OpenStats

Communities ranked by Health Canada survey mean indoor radon (Bq/m³). Rank 1 is the highest mean. Decade panel years without a new survey carry the CMA survey vintage forward; they are not annual retests.

10 editions · 2016–2025

#109
Latest · 2025 · of 117
Score 35.4

sports · OpenStats

OpenStats Local Sports Depth

OpenStats

Cities ranked by weighted count of documented local teams (pro, junior, university, high-school hubs). Rank 1 = deepest documented sports footprint among covered seed cities. Not a claim about on-field success. See sports methodology for weights and gaps.

Single edition · 2025

#1
Published · 2025 · of 172
Score 73

Only one published edition places Vancouver in this study so far. Open the edition for method notes and the full table.

Original source · Full edition

Growth · OpenStats

OpenStats Population Growth

OpenStats

Cities ranked by year-over-year population growth from Statistics Canada annual CSD estimates (Table 17-10-0155-01). Rank 1 is fastest growth. A few places without a clean CSD match use a provincial-path estimate anchored to seed population.

10 editions · 2016–2025

#169
Latest · 2025 · of 172
Score -0.01112998605746887

Property tax · OpenStats

OpenStats Residential Mill Rates

OpenStats

Municipalities ranked by residential mill rate. Rank 1 is the highest rate. Published municipal years are used when available; gaps are interpolated or follow the provincial median path so the tax pillar moves year to year for every city.

10 editions · 2016–2025

#77
Latest · 2025 · of 172
Score 11.392709979084914

Hazards · OpenStats

OpenStats Seismic Hazard (PGA)

OpenStats

Communities ranked by NRCan peak ground acceleration (higher = stronger shaking hazard). Rank 1 is highest PGA. The seismic model is multi-year; values are carried across the City Score panel and flagged as static until NRCan publishes a new generation.

10 editions · 2016–2025

#11
Latest · 2025 · of 172
Score 0.253

Housing

CMHC Average 2-Bedroom Rent — Lowest Rent

Canada Mortgage and Housing Corporation

Average rent for purpose-built 2-bedroom apartments (all tenants) from CMHC Rental Market Survey. Rank 1 = lowest average rent among covered CMAs.

Single edition · 2025

#18
Published · 2025 · of 18
Score 2363

Only one published edition places Vancouver in this study so far. Open the edition for method notes and the full table.

Original source · Full edition

Livability

Globe and Mail Most Livable Cities

The Globe and Mail

2023 data partnership with Environics Analytics ranking 439 Canadian communities on ten livability categories.

Single edition · 2023

#14
Published · 2023 · of 439

Only one published edition places Vancouver in this study so far. Open the edition for method notes and the full table.

Original source · Full edition

Worth knowing in Vancouver

Distinctive local notes and places, each linked to its source.

  • TransLink describes three SkyTrain lines from Downtown: Expo, Millennium, and Canada Line to YVR and Richmond.

    TransLink

  • Waterfront Station appears as the shared downtown endpoint across SkyTrain line maps.

    TransLink

  • Broadway Subway construction is a standing TransLink alert that relocates stops around Broadway–City Hall.

    TransLink

  • Metro Vancouver posts Stage 2 water restrictions as regional rules, including lawn-watering bans.

    Metro Vancouver

Places to see

Waterfront Station

Downtown SkyTrain hinge where Expo, Millennium, and Canada Line riders meet the core. It is the station name locals use when giving directions without listing every branch.

Gastown

Historic downtown strip that keeps showing up in Sun local-food coverage. Restaurant talk still uses Gastown as a place name, not a theme-park label.

B.C. Place

Stadium that anchors Whitecaps and public-asset conversations on the local sports and business desks. Ownership talk and match-day geography both land here.

Broadway Subway corridor

Active construction zone near Broadway–City Hall where TransLink warns about relocated bus stops and traffic changes. Commute planning starts with that caveat.

Follow Vancouver by email

When Vancouver moves in a ranking, posts new permit figures, or lands in a study, get a short note. A few sends a year, only when something changes.

No spam. Unsubscribe with one reply.

Related guides

More places in British Columbia

All British Columbia cities